
Compare company tech stack tools
Find internal SaaS that public signals miss, then prioritize companies with estimated subscription spend. Explore the evidence by service category and compare anvendor with individual tools.
See the SaaS
public signals miss.
48%
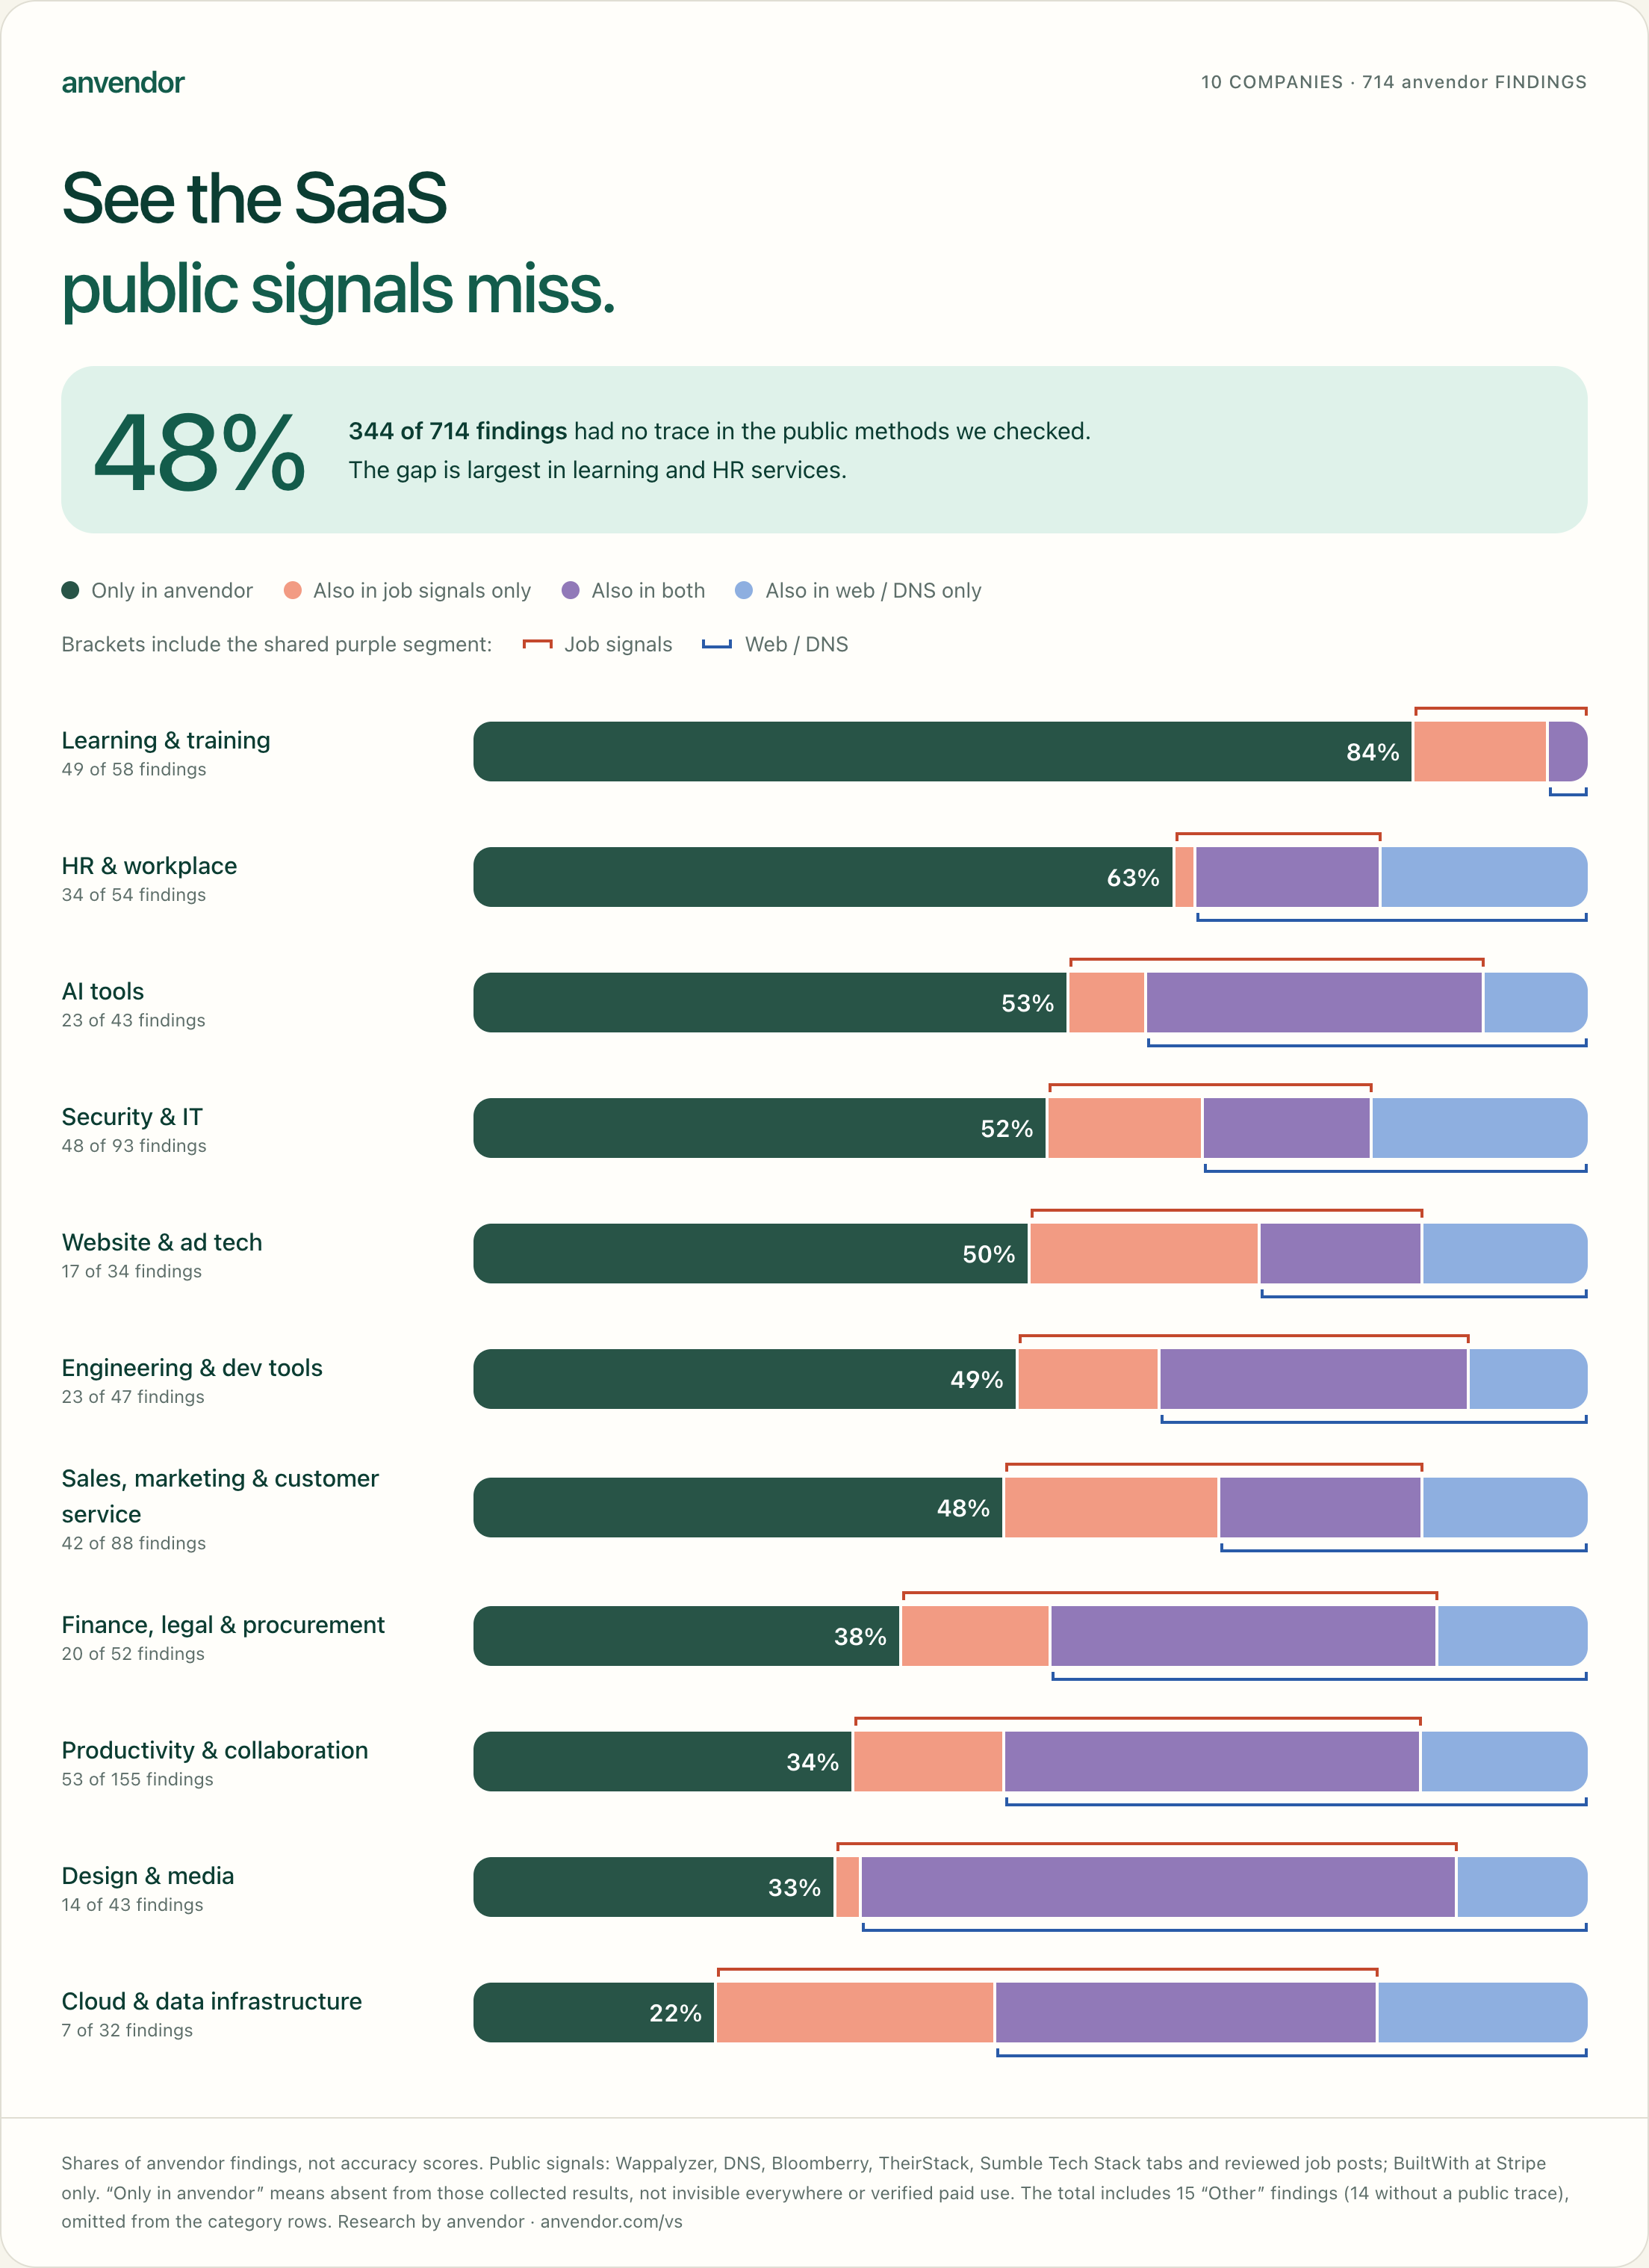
344 of 714 findings had no trace in the public methods we checked. The gap is largest in learning and HR services.
Learning & training
49 of 58 findings
HR & workplace
34 of 54 findings
AI tools
23 of 43 findings
Security & IT
48 of 93 findings
Website & ad tech
17 of 34 findings
Engineering & dev tools
23 of 47 findings
Sales, marketing & customer service
42 of 88 findings
Finance, legal & procurement
20 of 52 findings
Productivity & collaboration
53 of 155 findings
Design & media
14 of 43 findings
Cloud & data infrastructure
7 of 32 findings
Put a price range
next to the prospect.
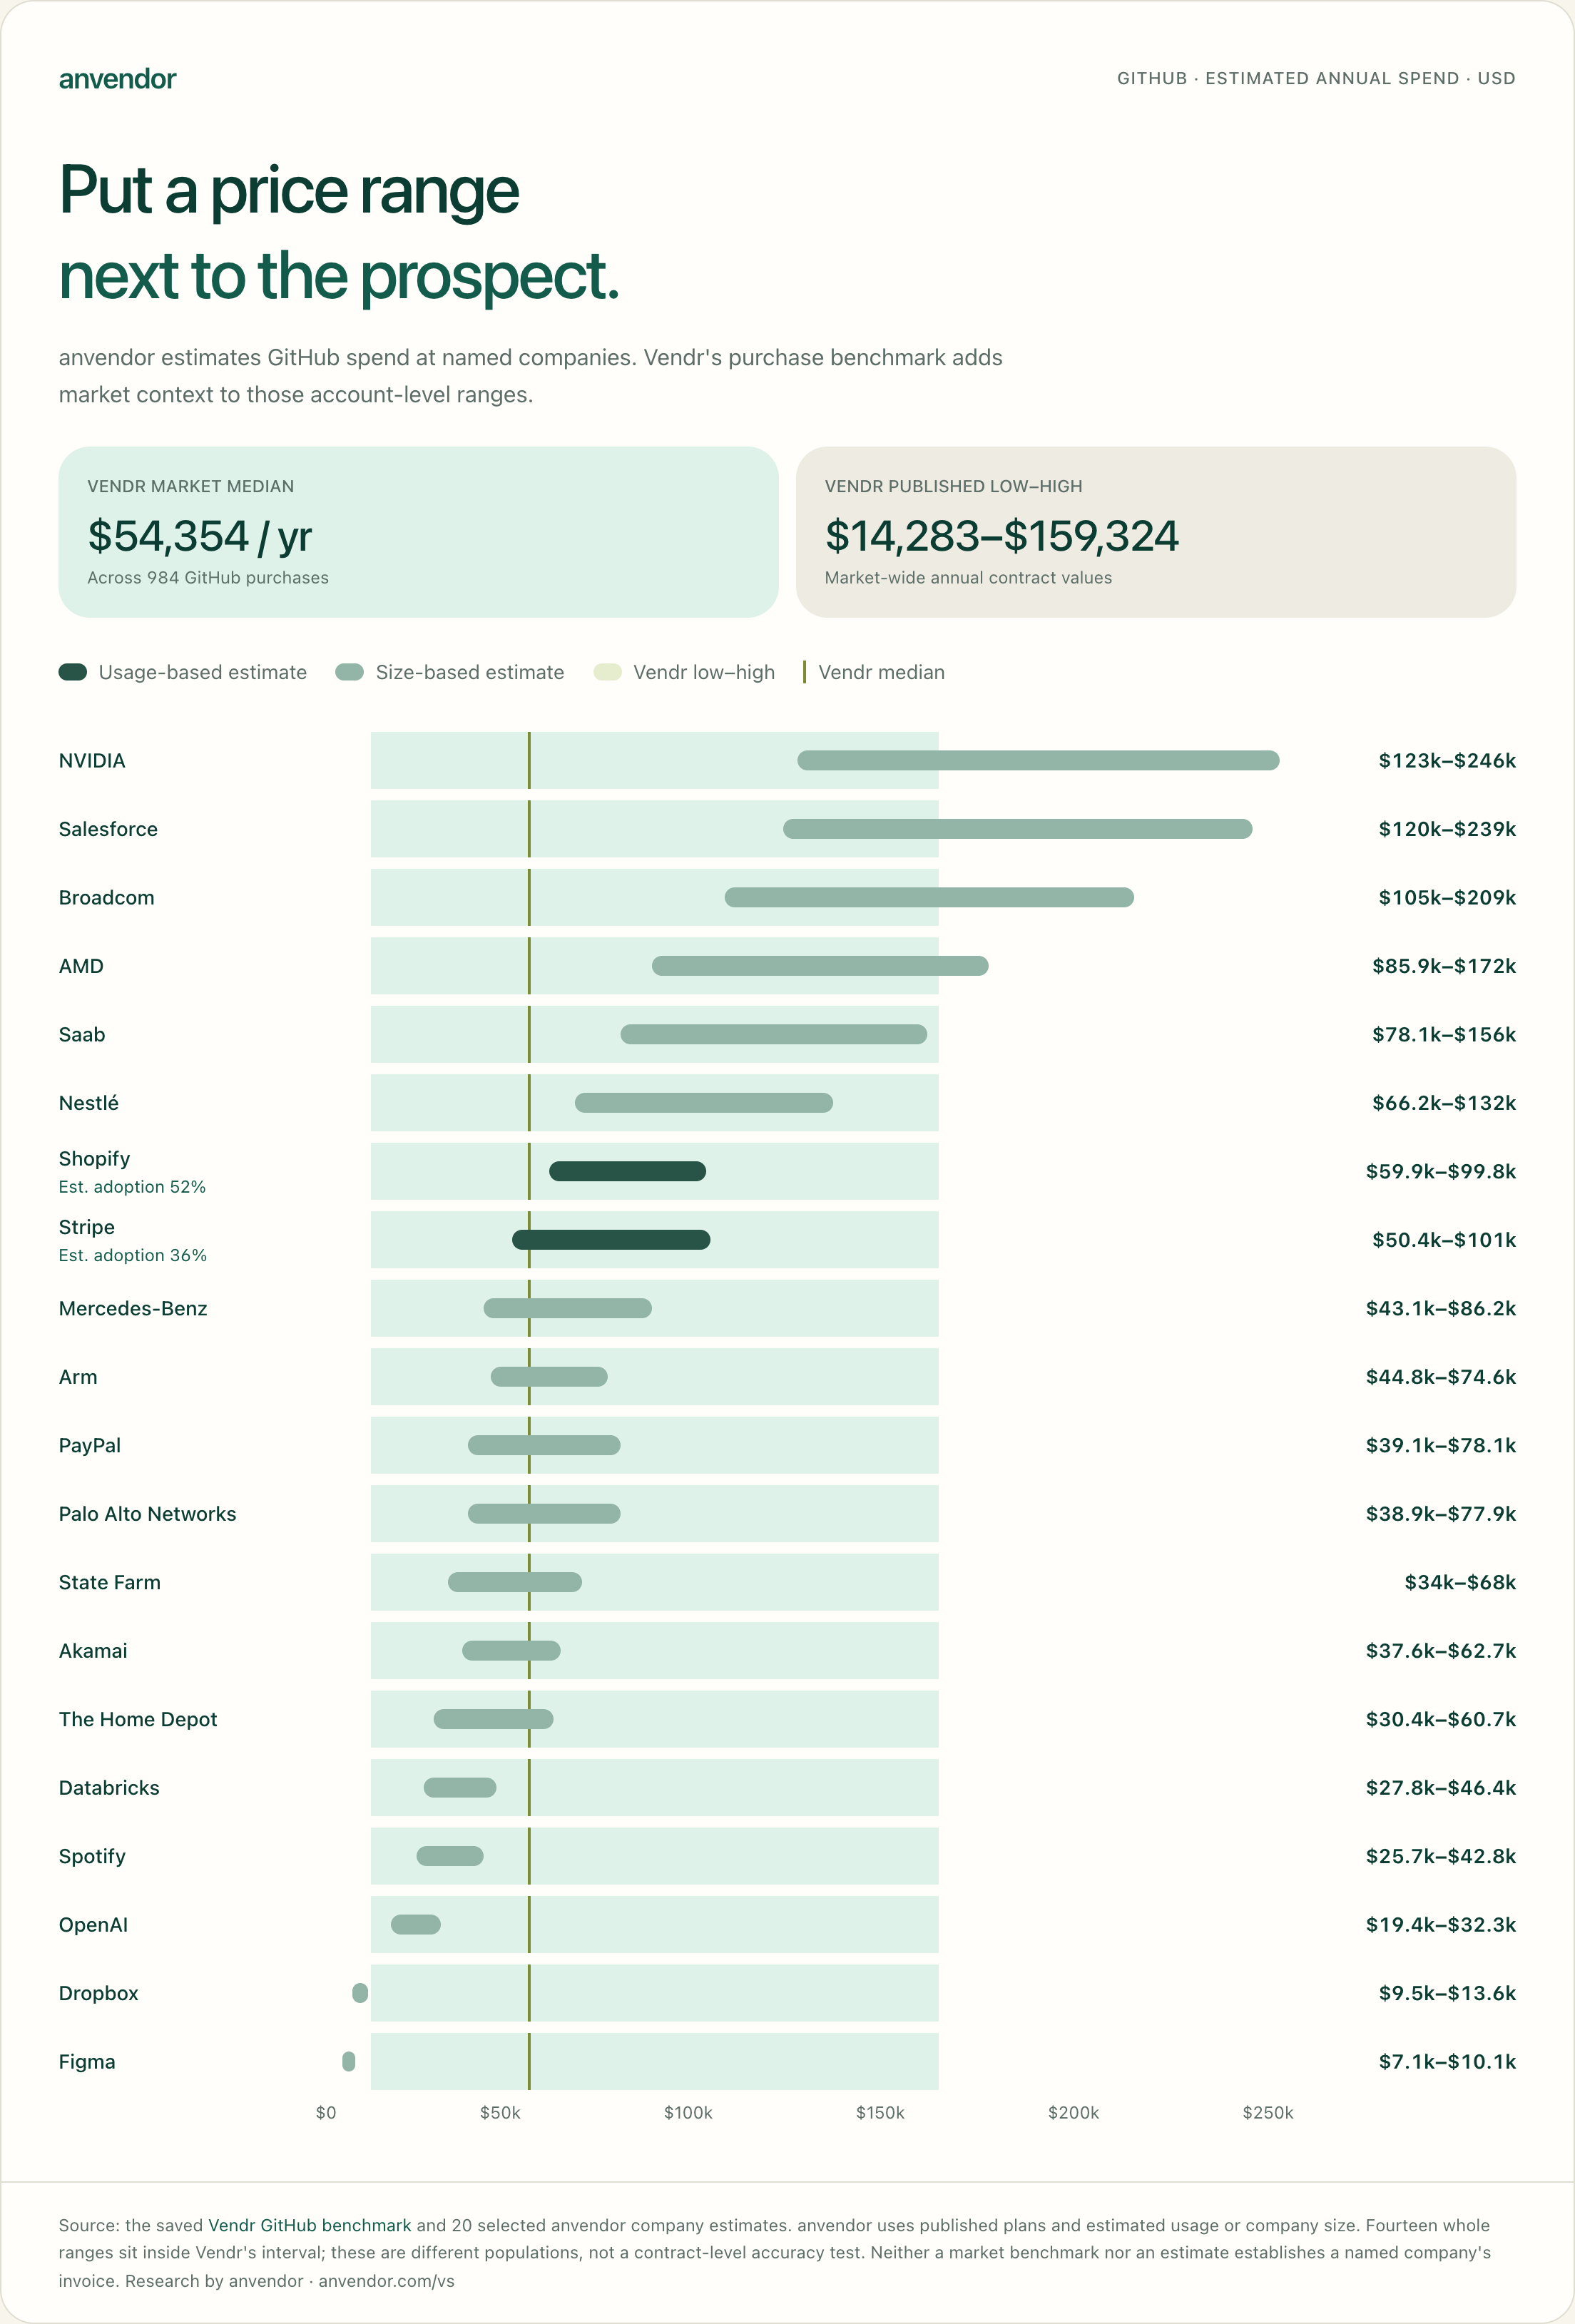
anvendor estimates GitHub spend at named companies. Vendr's purchase benchmark adds market context to those account-level ranges.
VENDR MARKET MEDIAN
$54,354 / yr
Across 984 GitHub purchases
VENDR PUBLISHED LOW–HIGH
$14,283–$159,324
Market-wide annual contract values
NVIDIA
$123k–$246k
Salesforce
$120k–$239k
Broadcom
$105k–$209k
AMD
$85.9k–$172k
Saab
$78.1k–$156k
Nestlé
$66.2k–$132k
ShopifyEst. adoption 52%
$59.9k–$99.8k
StripeEst. adoption 36%
$50.4k–$101k
Mercedes-Benz
$43.1k–$86.2k
Arm
$44.8k–$74.6k
PayPal
$39.1k–$78.1k
Palo Alto Networks
$38.9k–$77.9k
State Farm
$34k–$68k
Akamai
$37.6k–$62.7k
The Home Depot
$30.4k–$60.7k
Databricks
$27.8k–$46.4k
Spotify
$25.7k–$42.8k
OpenAI
$19.4k–$32.3k
Dropbox
$9.5k–$13.6k
Figma
$7.1k–$10.1k
Download the infographic (PNG)
Methodology, tested services & customer references
Companies checked: Atlassian (atlassian.com), Canva (canva.com), Shopify (shopify.com), Okta (okta.com), HubSpot (hubspot.com), Databricks (databricks.com), OpenAI (openai.com), Ramp (ramp.com), Stripe (stripe.com) and Airbnb (airbnb.com). We selected well-known technology companies often named in customer references, with roughly fewer than 15,000 staff and matching website and corporate domains. This is a selected sample, not a representative market survey.
The starting point: vendors’ own customer logos and case studies. A company logo, customer story or testimonial published by a service vendor supplied a reference pair: for example, Stripe named by BrowserStack becomes stripe.com × BrowserStack. We then checked whether each collected tool result named that vendor or a matching product.
The reference set contains 316 relationships from 207 vendors: 175 involving vendors in anvendor's catalogue, reviewed individually, plus 141 involving additional vendors. For the additional group, a named product belonging to the vendor counted. Three SendGrid references duplicated Twilio relationships and were excluded.
What the percentages mean. On competitor pages, found ÷ published reference pairs is positive-reference recall. There are no verified negatives, so this does not measure precision. References may be old, describe one team or favour prominent companies. The catalogue subset favours anvendor's coverage; the added vendors came from collected tool lists, so vendors no method reported are omitted. We build anvendor and did not independently verify paid contracts. Missing evidence does not establish non-use.
A separate category analysis: the visibility infographic starts with 714 anvendor findings across 266 distinct services at those ten companies, rather than the 316 published reference pairs. Each finding is classified by service category and checked for traces in website/DNS/infrastructure results, job signals, both or neither. Its percentages are shares of anvendor findings, not retrieval accuracy. BuiltWith covers Stripe only, Sumble its Tech Stack tabs; the collected surfaces do not represent every competitor's full product.
Pricing: 20 selected GitHub estimates use published plans and estimated usage or company size. Vendr's saved GitHub benchmark covers 984 purchases from a different population. The interval overlap provides context; no named company's invoice was checked. Results were saved at different times, rather than collected simultaneously.
Download all 316 reference pairs and source links (CSV)
All 207 tested reference vendors
Each name links to a vendor-published reference page. The CSV maps every company-service pair to its source; this list describes the reference set, not anvendor's entire catalogue or all technologies returned by competitors.
- 15Five15five.com
- 1Password1password.com
- 6sense6sense.com
- Absorb LMSmyabsorb.com
- Accredibleaccredible.com
- Adaptive Securityadaptivesecurity.com
- AfterShipaftership.com
- Agiloftagiloft.com
- Aha!aha.io
- Ahrefsahrefs.com
- Airair.inc
- Airtableairtable.com
- Allocadiaallocadia.com
- Amazon Web Servicesamazon.com
- Amplitudeamplitude.com
- Anaplananaplan.com
- Anthropicanthropic.com
- Anyscaleanyscale.com
- Anyspherecursor.com
- AppZenappzen.com
- Archiearchieapp.co
- Articulatearticulate.com
- Ashbyashbyhq.com
- Atlanatlan.com
- Awardcoaward.co
- BenQbenq.com
- Bevybevy.com
- BigMarkerbigmarker.com
- Bitrisebitrise.io
- Bizzabobizzabo.com
- Blinqblinq.me
- Branchbranch.io
- Brazebraze.com
- Brexbrex.com
- BrowserStackbrowserstack.com
- Bugcrowdbugcrowd.com
- BugHerdbugherd.com
- Buildkitebuildkite.com
- Camundacamunda.com
- Canvacanva.com
- Cerebrascerebras.ai
- Chainguardchainguard.dev
- Checklychecklyhq.com
- Chili Piperchilipiper.com
- CircleCIcircleci.com
- Clariclari.com
- Clayclay.com
- ClickHouseclickhouse.com
- Cockroach Labscockroachlabs.com
- Codilitycodility.net
- Common Roomcommonroom.io
- Cortexcortex.io
- Crowdvocatecrowdvocate.com
- Datadogdatadoghq.com
- DataGraildatagrail.io
- Datasitedatasite.com
- dbt Labsgetdbt.com
- Descriptdescript.com
- Devindevin.ai
- Diffcheckerdiffchecker.com
- Discoursediscourse.org
- DocuSigndocusign.com
- Doppeldoppel.com
- Dovetaildovetail.com
- Dragon Metricsdragonmetrics.com
- Driftdrift.com
- dscoutdscout.com
- ElevenLabselevenlabs.io
- Envoyenvoy.com
- Expensifyexpensify.com
- fal.aifal.ai
- FAX.PLUSfax.plus
- Fellowfellow.app
- Figmafigma.com
- Firecrawlfirecrawl.dev
- Fivetranfivetran.com
- FloQastfloqast.com
- Formatwic.ai
- Freshservicefreshservice.com
- Gainsightgainsightcloud.com
- GeeTestgeetest.com
- Genea Securitysequr.io
- General Translationgeneraltranslation.com
- getAbstractgetabstract.com
- GitHubgithub.com
- Gleanglean.com
- Gonggong.io
- GoodTimegoodtime.io
- Google Workspacegoogle.com
- Grafana Labsgrafana.com
- Grammarlygrammarly.com
- Granolagranola.ai
- Greenhousegreenhouse.io
- greytHRgreythr.com
- Gumloopgumloop.com
- HackerOnehackerone.com
- HackerRankhackerrank.com
- Handshakejoinhandshake.com
- Hexhex.tech
- Hugging Facehuggingface.co
- impact.comimpact.com
- Impartnerimpartner.com
- Incident.io Status Pagesincident.io
- Integratelyintegrately.com
- Intuition Machineshcaptcha.com
- Jitterjitter.video
- Keyword Toolkeywordtool.io
- Kryterionkryterion.com
- Langfuselangfuse.com
- LeanDataleandata.com
- Leapfinleapfin.com
- Lindylindy.ai
- Linearlinear.app
- Living Securitylivingsecurity.com
- Loomloom.com
- Loopioloopio.com
- LottieFileslottiefiles.com
- Lucidlucid.app
- Lucidchartlucidchart.com
- LucidLinklucidlink.com
- Magnoliamagnolia-cms.com
- Medalliamedallia.com
- Metronomemetronome.com
- Mixmaxmixmax.com
- Mode Analyticsmode.com
- Modern Healthmodernhealth.com
- monday.commonday.com
- Monte Carlomontecarlodata.com
- Moveworksmoveworks.com
- Nagiosnagios.com
- Navan (TripActions)tripactions.com
- Navatticnavattic.com
- Neatneat.no
- Nicereplynicereply.com
- Nooksnooks.ai
- North Pole Securitynorthpolesec.com
- Notionnotion.so
- OfficeSpaceofficespacesoftware.com
- Onitonit.com
- Orumorum.com
- Oryory.sh
- Outreachoutreach.io
- OverDrivelibraryreserve.com
- Pantheonpantheon.io
- Papaya Globalpapayaglobal.com
- Pavepave.com
- Pendopendo.io
- Perplexityperplexity.ai
- Pineconepinecone.io
- PingCAPpingcap.com
- Pocuspocus.com
- PortSwiggerportswigger.net
- Postmangetpostman.com
- Profoundtryprofound.com
- Pulumipulumi.com
- Qdrantqdrant.tech
- Rampramp.com
- Relevance AIrelevanceai.com
- Renderrender.com
- Retoolretool.com
- Robinrobinpowered.com
- SafeBasesafebase.io
- Salesloftsalesloft.com
- SeekOutseekout.io
- Sentrysentry.io
- Servalserval.com
- Skilljarskilljar.com
- Slabslab.com
- Snowflakesnowflake.com
- Snyksnyk.io
- Social Nativesocialnative.com
- Statsigstatsig.com
- Stripestripe.com
- Sumo Logicsumologic.com
- SuperAnnotatesuperannotate.com
- Superhumansuperhuman.com
- SupportLogicsupportlogic.com
- Swoogoswoogo.com
- Team Treehouseteamtreehouse.com
- Temporal Technologiestemporal.io
- Thematicgetthematic.com
- Tiledtiled.co
- Tinestines.com
- Transifextransifex.com
- Tray.aitray.ai
- Trolleytrolley.com
- Twiliotwilio.com
- Uberuber.com
- Uniformuniform.dev
- User Interviewsuserinterviews.com
- Usersnapusersnap.com
- UserTestingusertesting.com
- Vantavanta.com
- Vercelvercel.com
- Watershedwatershed.com
- Wayleadrwayleadr.com
- WebinarGeekwebinargeek.com
- Weights & Biaseswandb.ai
- Whisticwhistic.com
- Wistiawistia.com
- WorkOSworkos.com
- Writerwriter.com
- Yoodliyoodli.ai
- Yugabyteyugabyte.com
- Zapierzapier.com
- Zipziphq.com
- Zylozylo.com
Start with a service and explore companies using it.
Browse companies by service